Time series data analysis
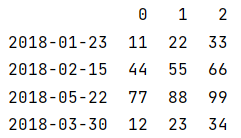
1. Basic operation of time series
1 | |
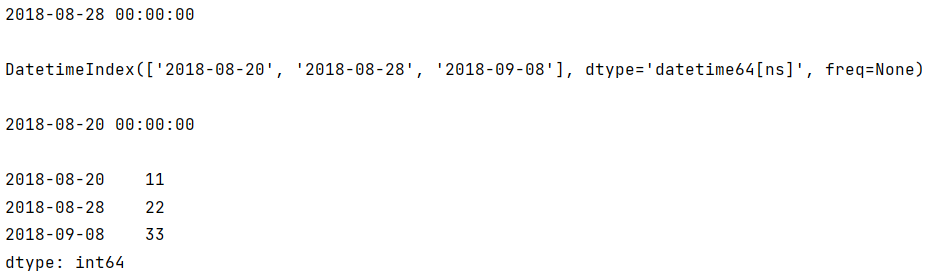
1 | |
2. Fixed frequency time series
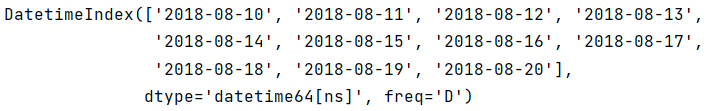
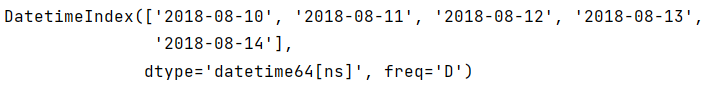
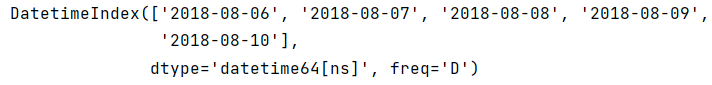
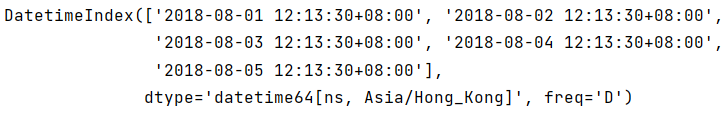
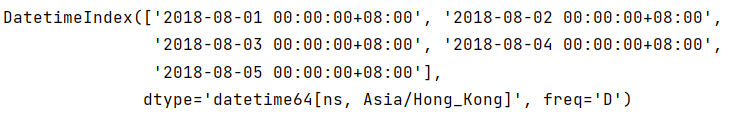
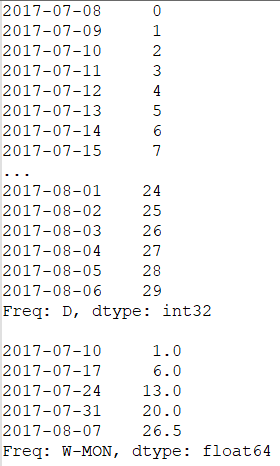
2.1 Create fixed frequency time series
official documentation: https://pandas.pydata.org/docs/reference/api/pandas.date_range.html
1 | |
1 | |
1 | |
1 | |

1 | |
1 | |
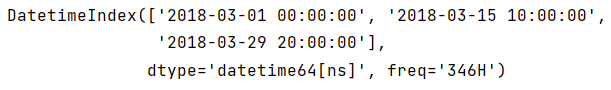
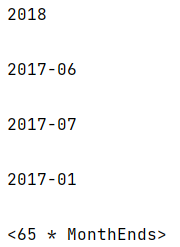
2.2 Frequency and offset of time series
1 | |

1 | |
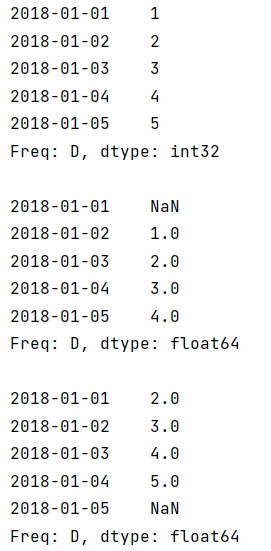
2.3 Shifting of time series
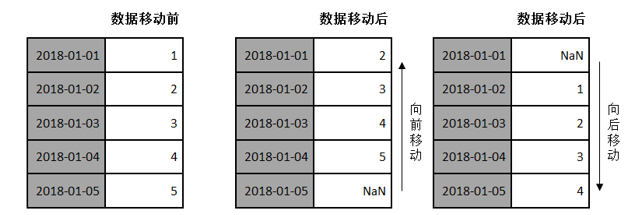
1 | |
3. Time period and calculation
3.1 Create a period object
1 | |
1 | |
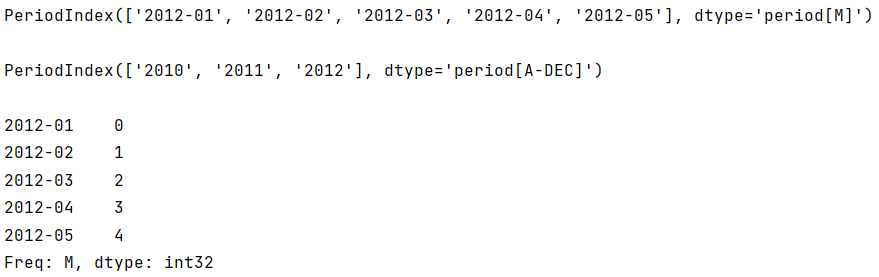
3.2 Period frequency conversion
1 | |

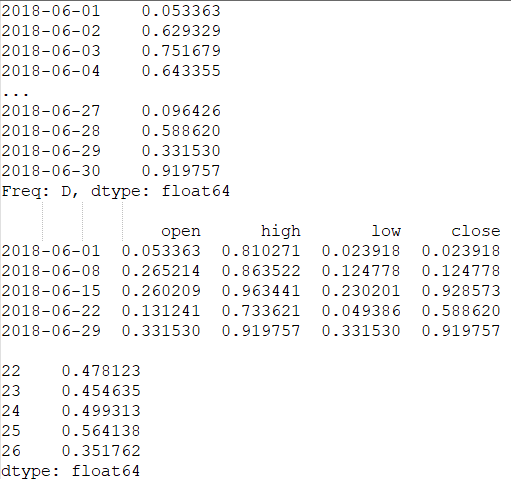
4. Resampling
4.1 Resample
1 | |
4.2 Downsampling
1 | |
4.3 Upsampling
1 | |

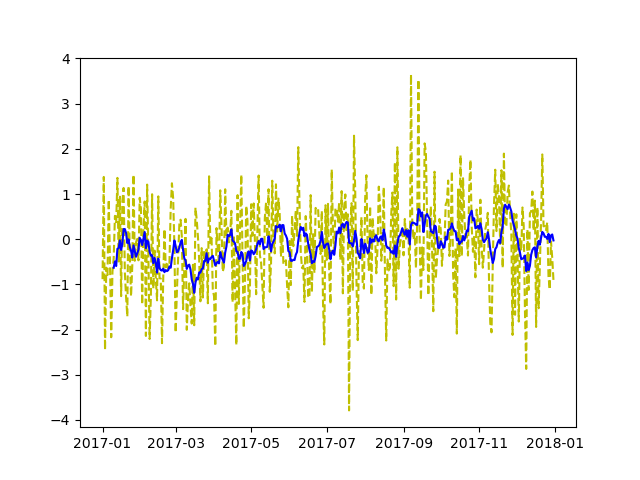
5. Data statistics - sliding window
1 | |

6. Time series model - Arima
Time series data analysis
https://www.hardyhu.cn/2022/03/27/Time-series-data-analysis/